Tools to analyse your financial performance and park operations
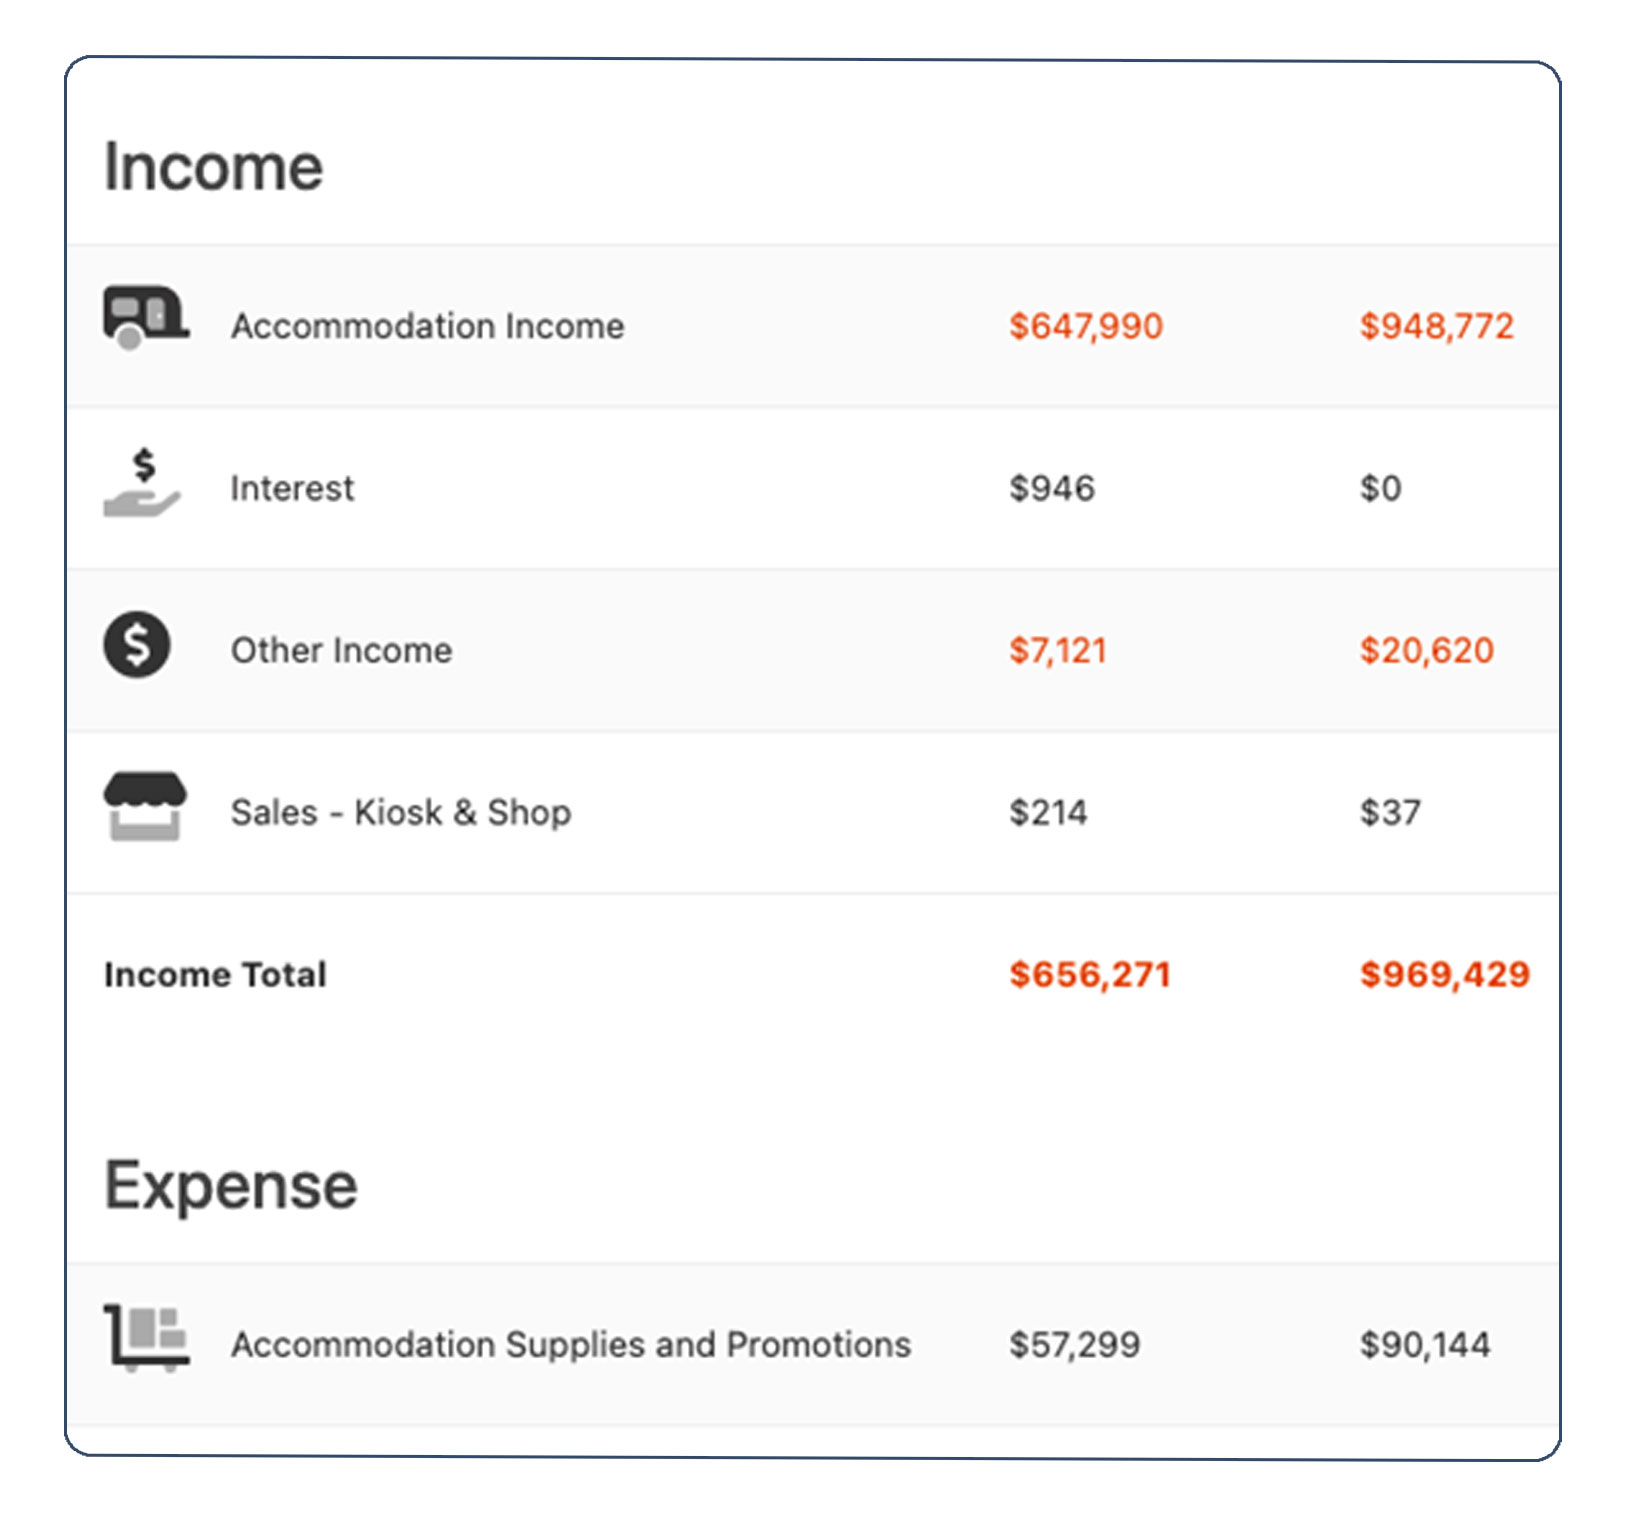
Deep dive into your finances, analysing the P&L for your group. Click to view each account and transaction while comparing your cost profile to industry norms.
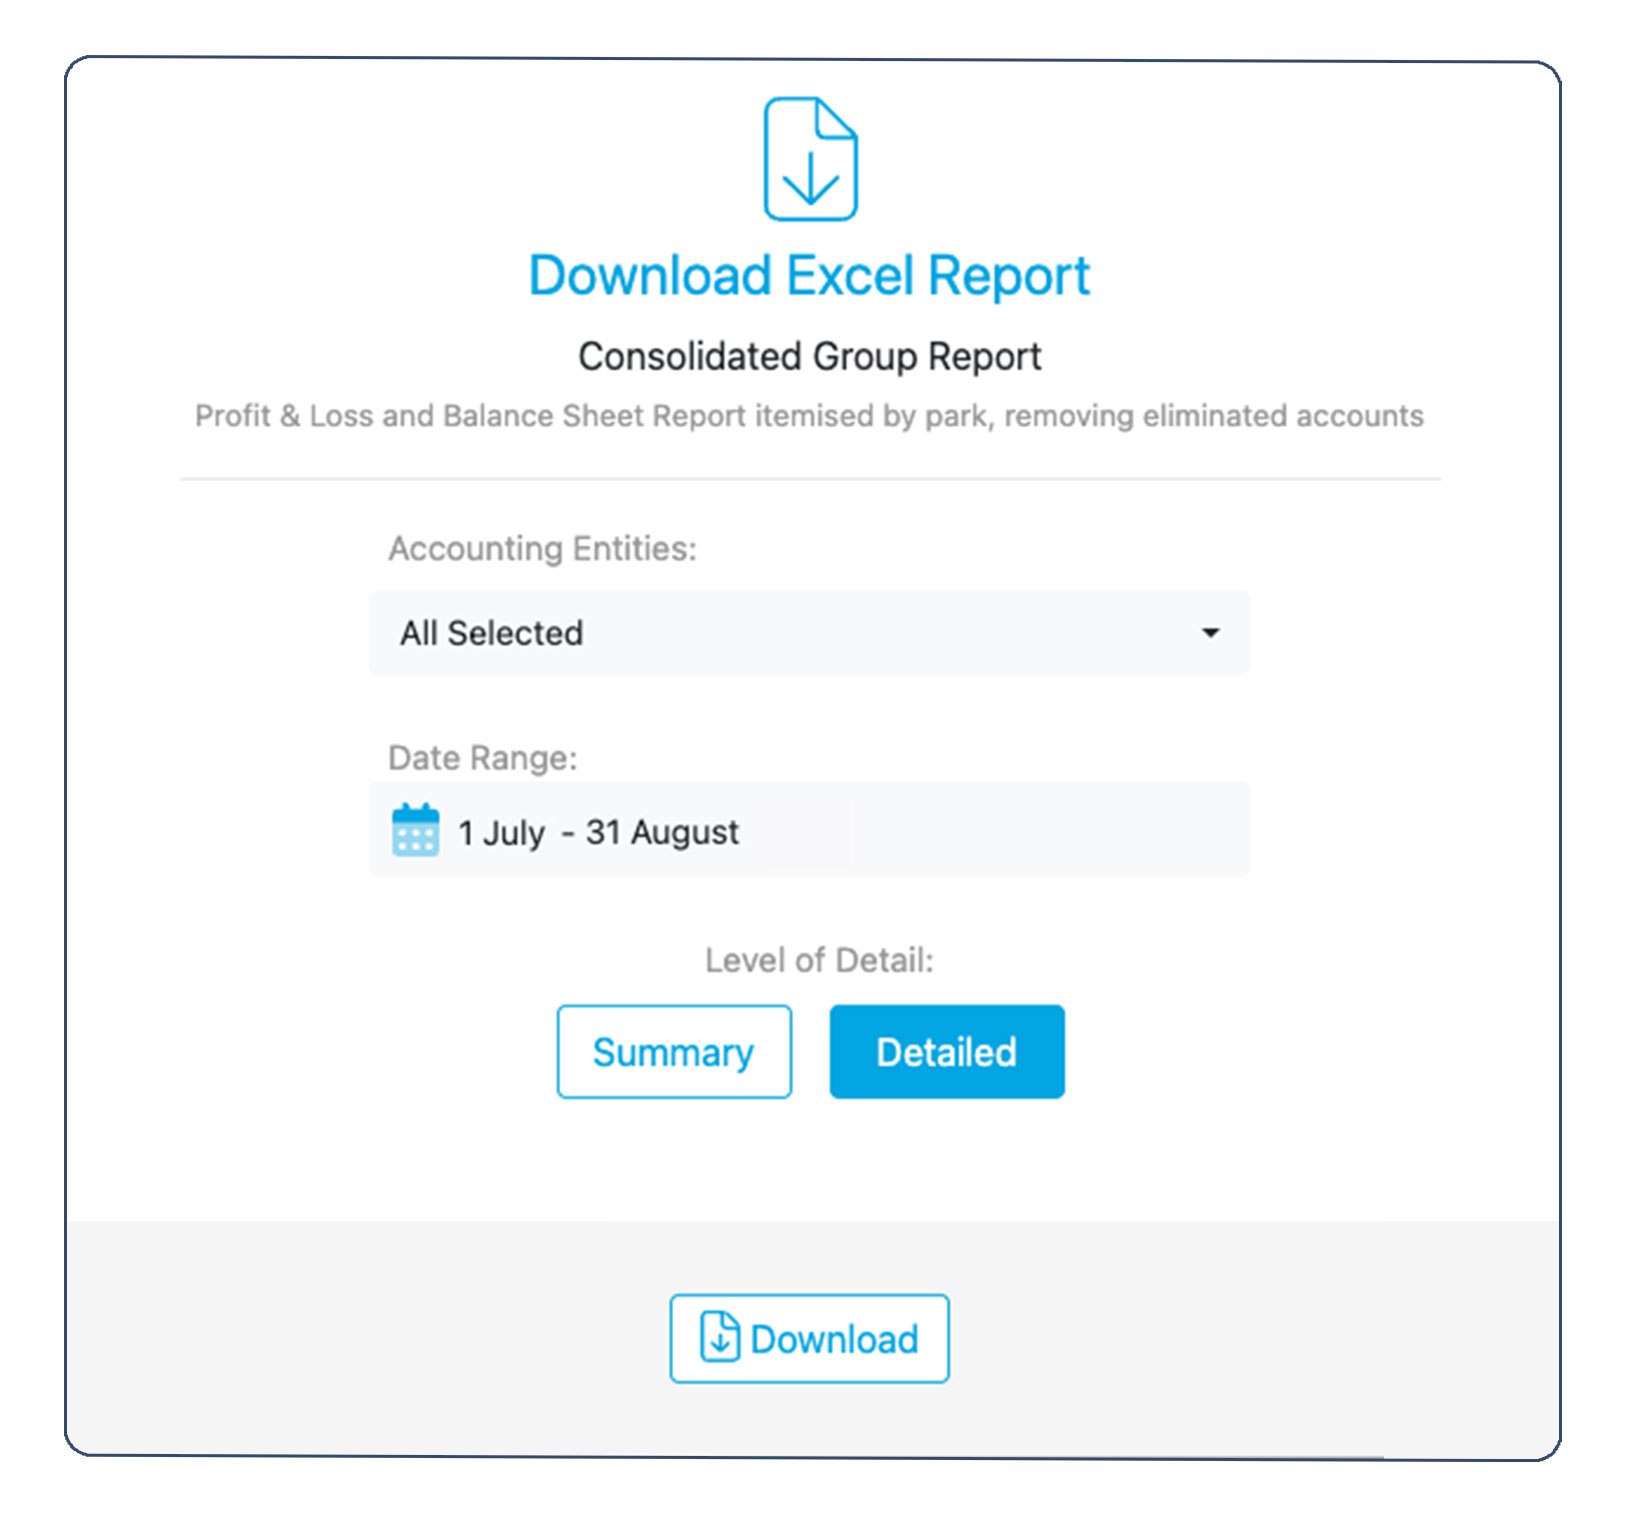
Advanced financial reporting in Excel format. Download group consolidation reports, eliminating inter-entity transactions. Requires Xero or MYOB bookkeeping software.
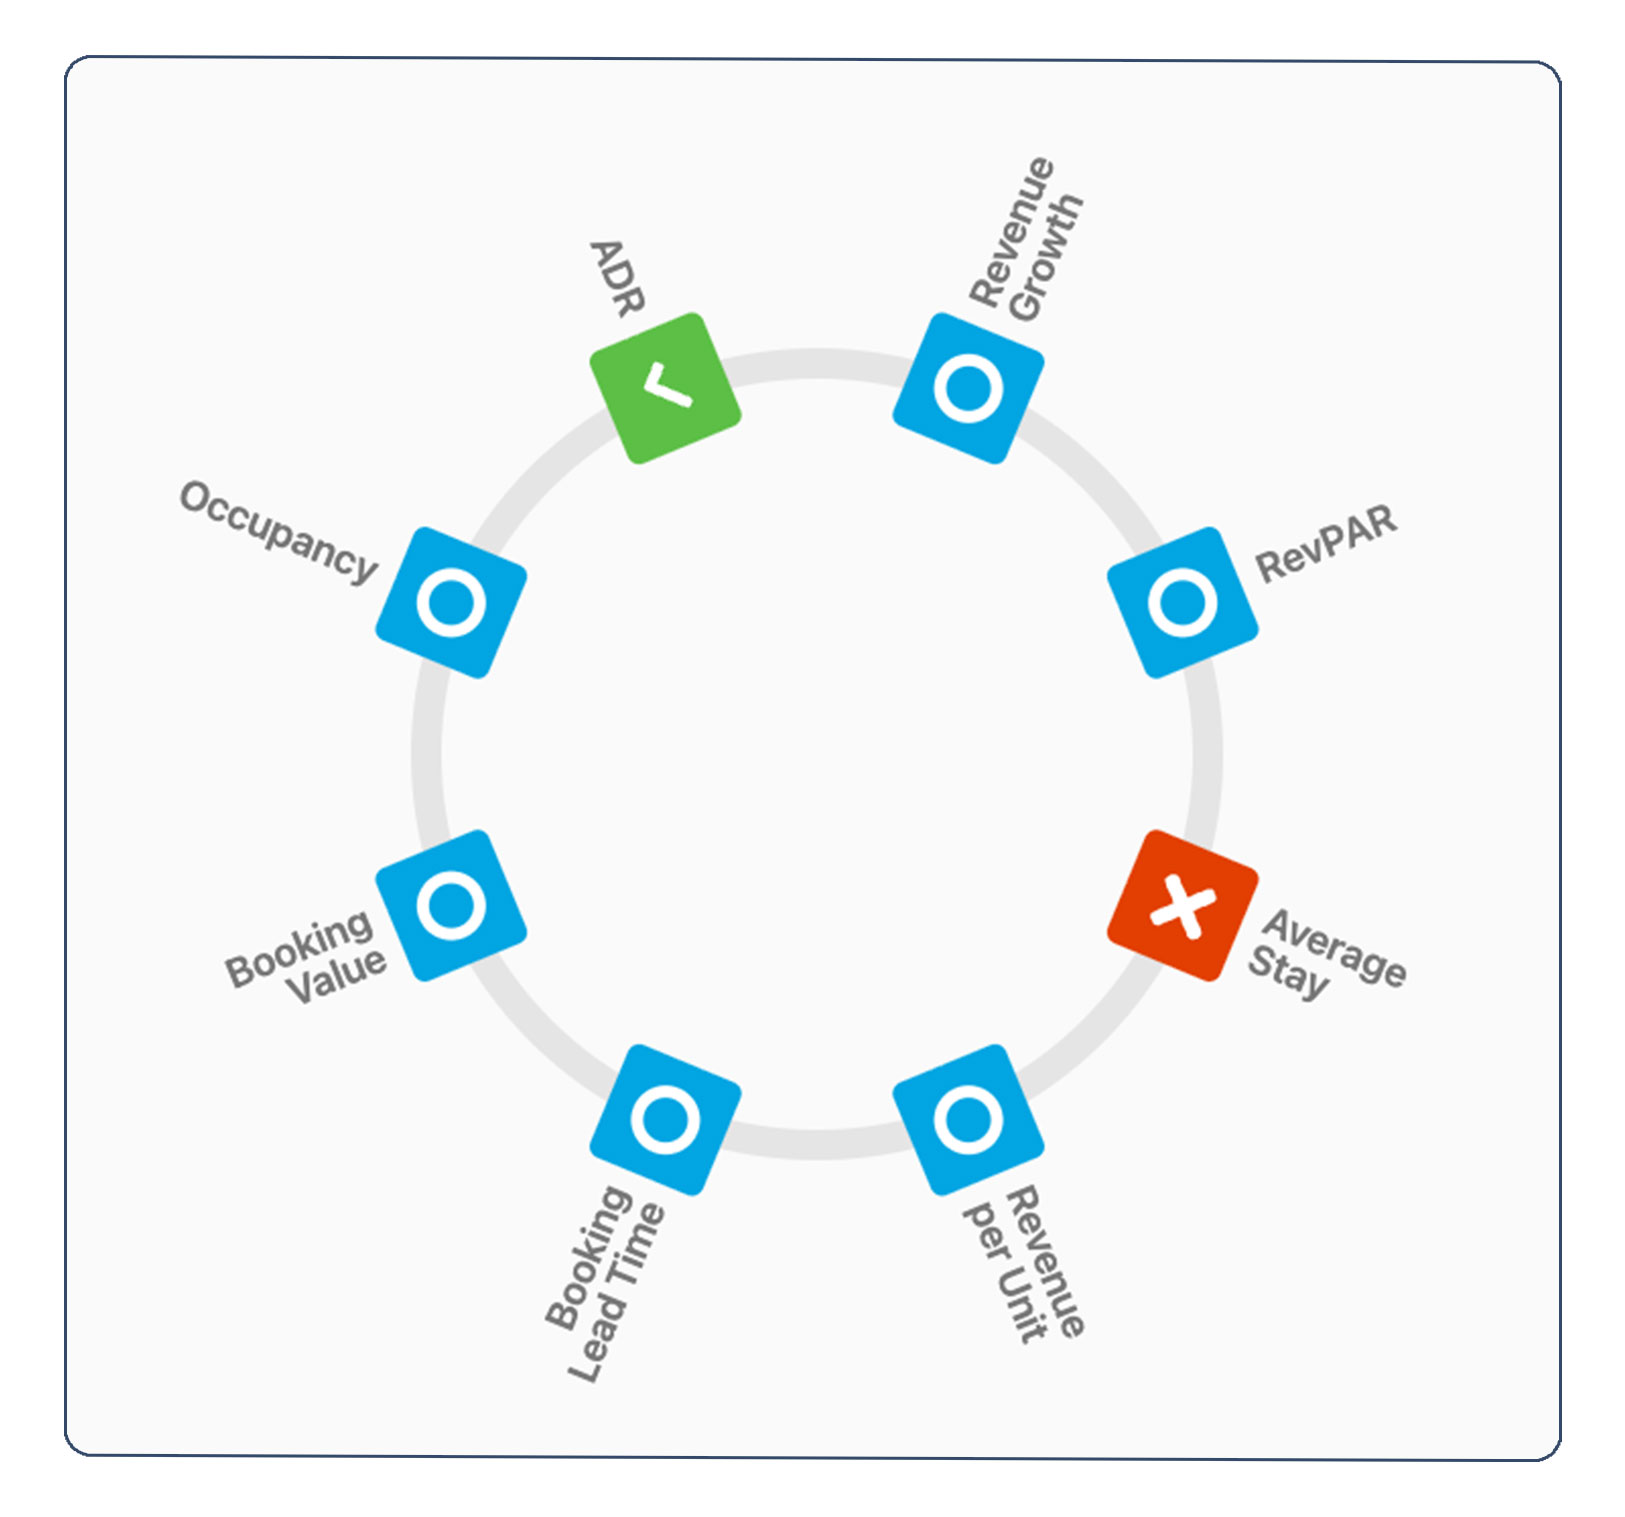
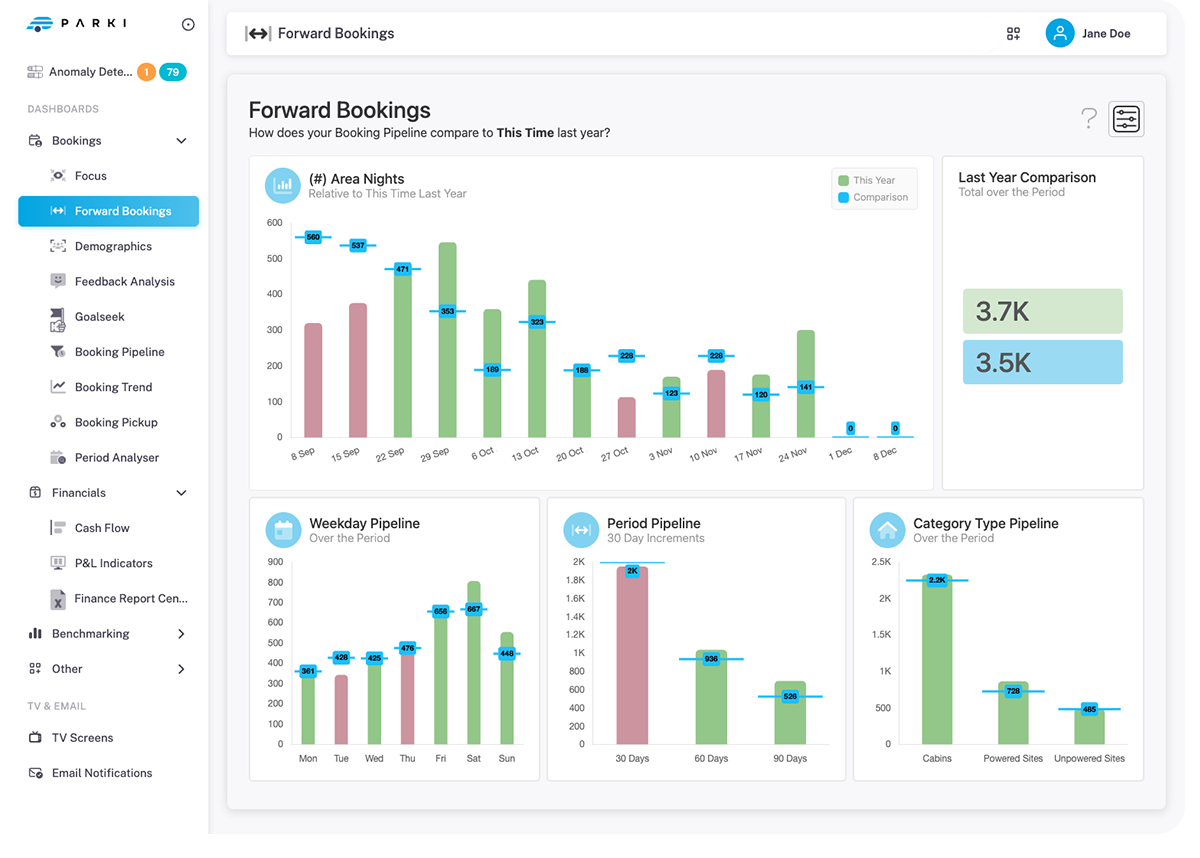
Compare your booking performance to industry norms. Evaluate your results alongside industry trends, while also comparing your results to Parki "peer" parks.
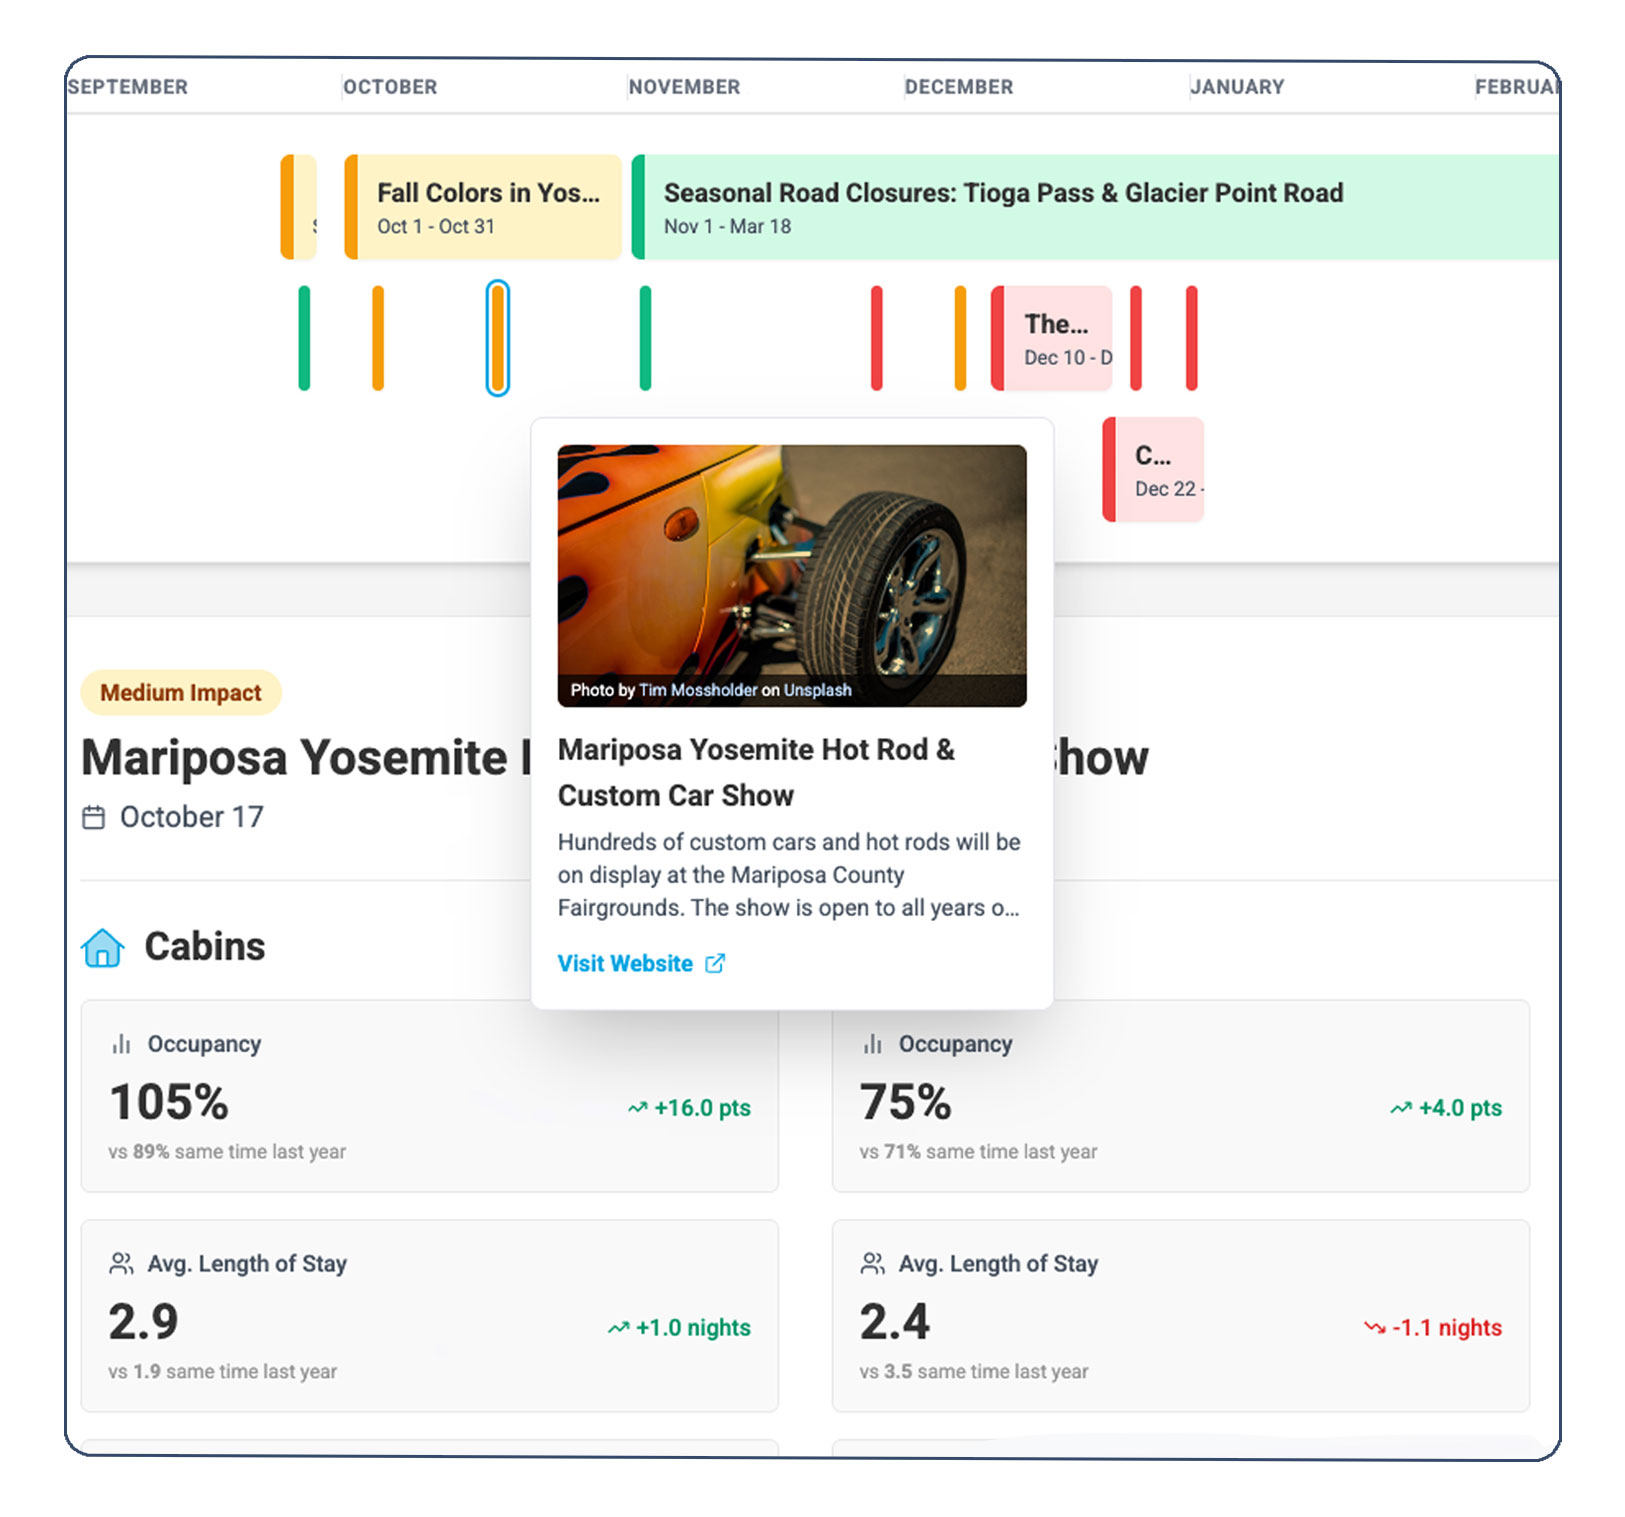
Use AI to search the web for upcoming events and activities, sports carnivals, music festivals, weather patterns and significant infrastructure projects that will impact your park.
KPI Tracking | Benchmarks | Custom Dashboards.