Parki.Cloud
Tourist Park Business Intelligence
The Tools You Need To Succeed
Parki gives tourist park owners and operators the information they need to make informed decisions.
Parki System Overview
See what Parki has to offer..


Click to View

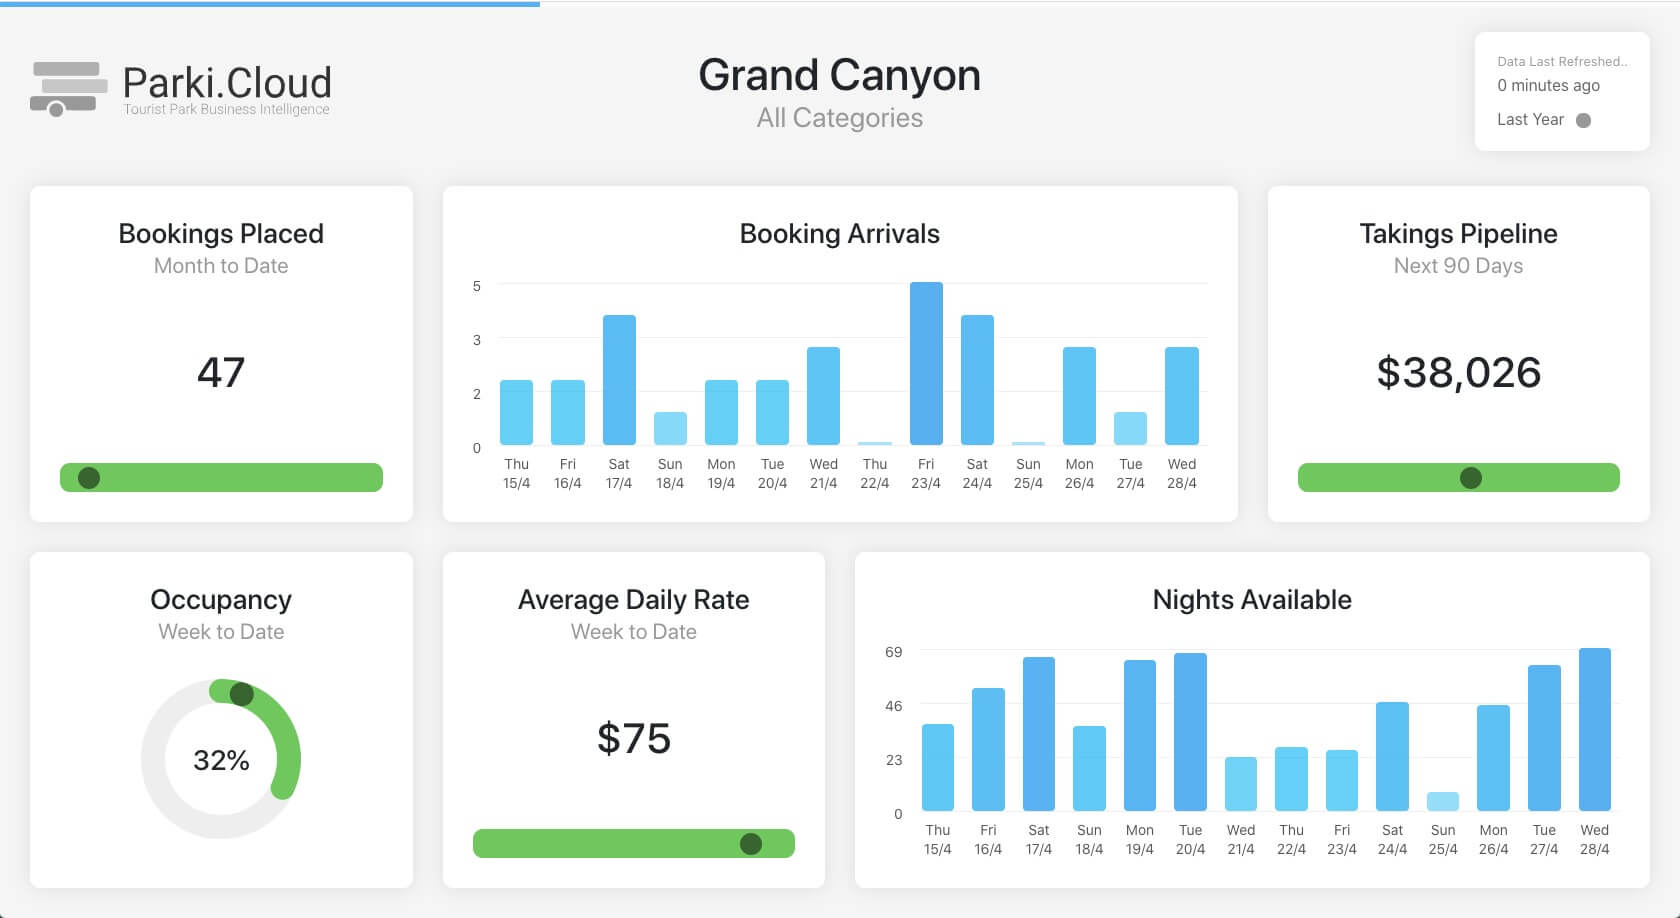
Parki Focus
A customisable dashboard of activity within the Park.
Drawing on data captured through a number of the Park’s sources.
Customise measures, time periods and comparisons against either last year or industry.
MoreLess..Some measures include
- Bookings Placed
- Average Daily Rate
- Occupancy
- Cancellations
- Nights Available
- Booking Arrivals
- Bookings By Source
- Discounts
- Takings Pipeline
- Nights Booked Pipeline
- Revenue Ex GST
Forward Bookings
Presents details on the number of nights booked as well as projected revenue for the next 90 days.
The report also presents these measures in comparison with the same period from previous years.
MoreLess..Some measures include
- Nights Booked
- Revenue Ex GST
Booking Pickup
Presents details on how bookings over the past 7 days have affected your forward bookings.
MoreLess..This dashboard displays the numbers of nights booked for your park over the next 90 days and shows how bookings placed over the last 7 days have changed your pipeline.
Booking data refreshes automatically every night with compatible Property Management Systems.
Some measures include
- Forward Bookings over the next 90 days
- Forward Bookings made in the last 7 days (Pickup Period)
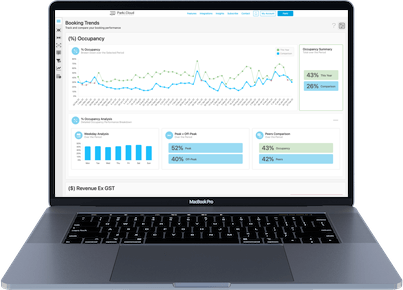
Booking Trend
This Report presents detailed analysis of (%)Occupancy, ($)Revenue, ($)Avg. Daily Rate and ($)RevPAR
The Report can be viewed on a weekly or monthly basis.
MoreLess..Pop-up information is available to show these measures by park and category type
Demographics
Identify where guest bookings are coming from.
Switch between viewing the guest booking method or a guest booking map to break down where your guests have booked based on their postcode.
MoreLess..Some measures include
- Number of bookings per month
- Number of bookings broken down into booking sources
- Number of bookings in comparison to the same time last year
- Guest booking location (displayed as a map)
- Top booking sources and top booking locations (postcode) for a given period
Housekeeping
Track and analyse the time and money spent on housekeeping tasks for a given period.
Period Analyser
Choose a defined period to visualise the performance of your park across common booking measures compared with last year.
Feedback
Analyse surveys collected through your Park’s Property Management System, Google My Business, ReviewPro and online reviews across a number of tracking KPI's.
MoreLess..Some measures include
- Total Survey Responses
- Total Average Review Score
- Total Survey Response Rate
- Guest Enjoyment (Net Promoter Score)
- Average Survey Review Score
- Number of Survey Responses over Time
- Common Survey Response Sentiments (common themes among what guests are saying)
Goalseek
Track and analyse the time and money spent on housekeeping tasks for a given period.
Bookings Pipeline
Track your forward bookings over the coming 90 days across a number of measures including total bookings, projected revenue and bookings pickup.
MoreLess..Some measures include
- Projected Revenue
- % Pickup over Period (selected in filter)
- Revenue Breakdown
- Total number of bookings
- Area Nights
Finance Reporting Centre
Generate Excel-based detailed finance reports.
From consolidated reporting of multiple entities, to budget and benchmark variance tracking, the Finance Report Centre provides detailed insights in Excel format.
MoreLess..Some reports include
- Consolidated Finance Report
- Budget / Last Year Comparison
- Benchmark Comparison
- Significant Account Variances
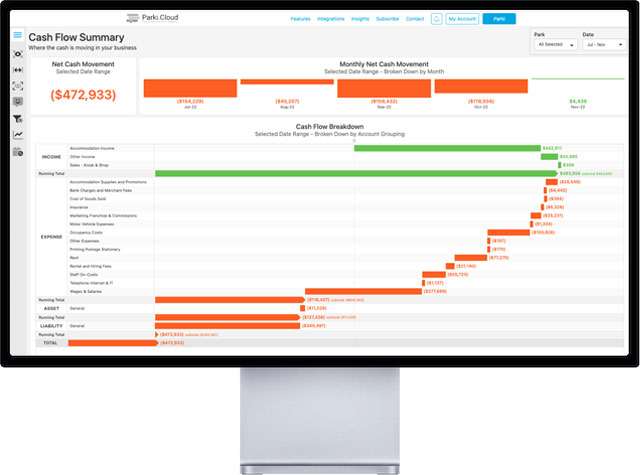
Cash Flow
Allows to you to view the cash flow activity of your business.
Identify where cash is arriving and leaving your business across a financial year or broken down into monthly time frames.
MoreLess..Some measures include
- Net Cash Flow
- Cash In
- Cash Out
- Cash Flow Breakdown
Profit and Loss Indicators
Allows for the conventional viewing of your profit and loss statement with industry comparison.
MoreLess..View your Profit and Loss grouped by benchmark category. Using the filters you can select a particular park or view your whole entity. Drill-down features allow you to compare to industry averages and view individual transactions.
Rates & Occupancy Industry Comparison
Using Accommodation takings data captured through the CaravanStats platform, we are able to provide detailed occupancy information for cabins, powered sites and unpowered sites by month and by state.
We combine this industry average occupancy data with booking results captured for your park.
MoreLess..Some measures include
- State industry average occupancy by cabins, powered sites and unpowered sites
- Your park’s average by cabins, powered sites and unpowered sites
- Your park’s difference to the state average
- Average monthly tariff rates for each category of accommodation in the park
Website
Draws on data collected through Google Analytics to identify trends in the performance of website traffic.
MoreLess..Some measures include
- Total Website Sessions
- Average Session Length
- User Growth (over the last year)
- Website Bounce Rate
- Website Traffic Sources
- Website Traffic from City
- Most Popular Landing Pages
- Sessions Over Time
- Most popular web pages (ranked, based on pageviews)
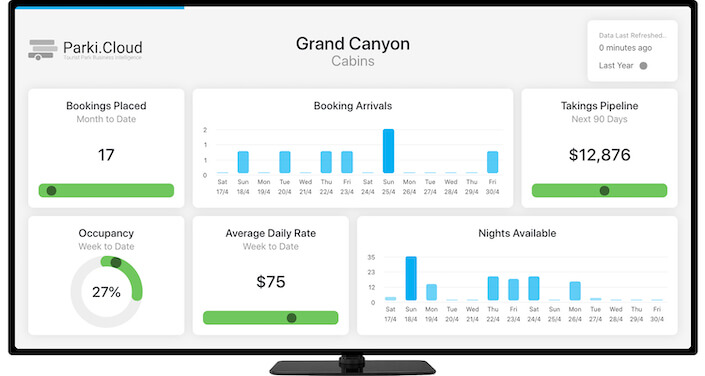
TV Screens
Parki includes additional dashboards built for TV screens to be displayed around the office.
These dashboards display a number of summarised operational measures to keep track of various KPI's.
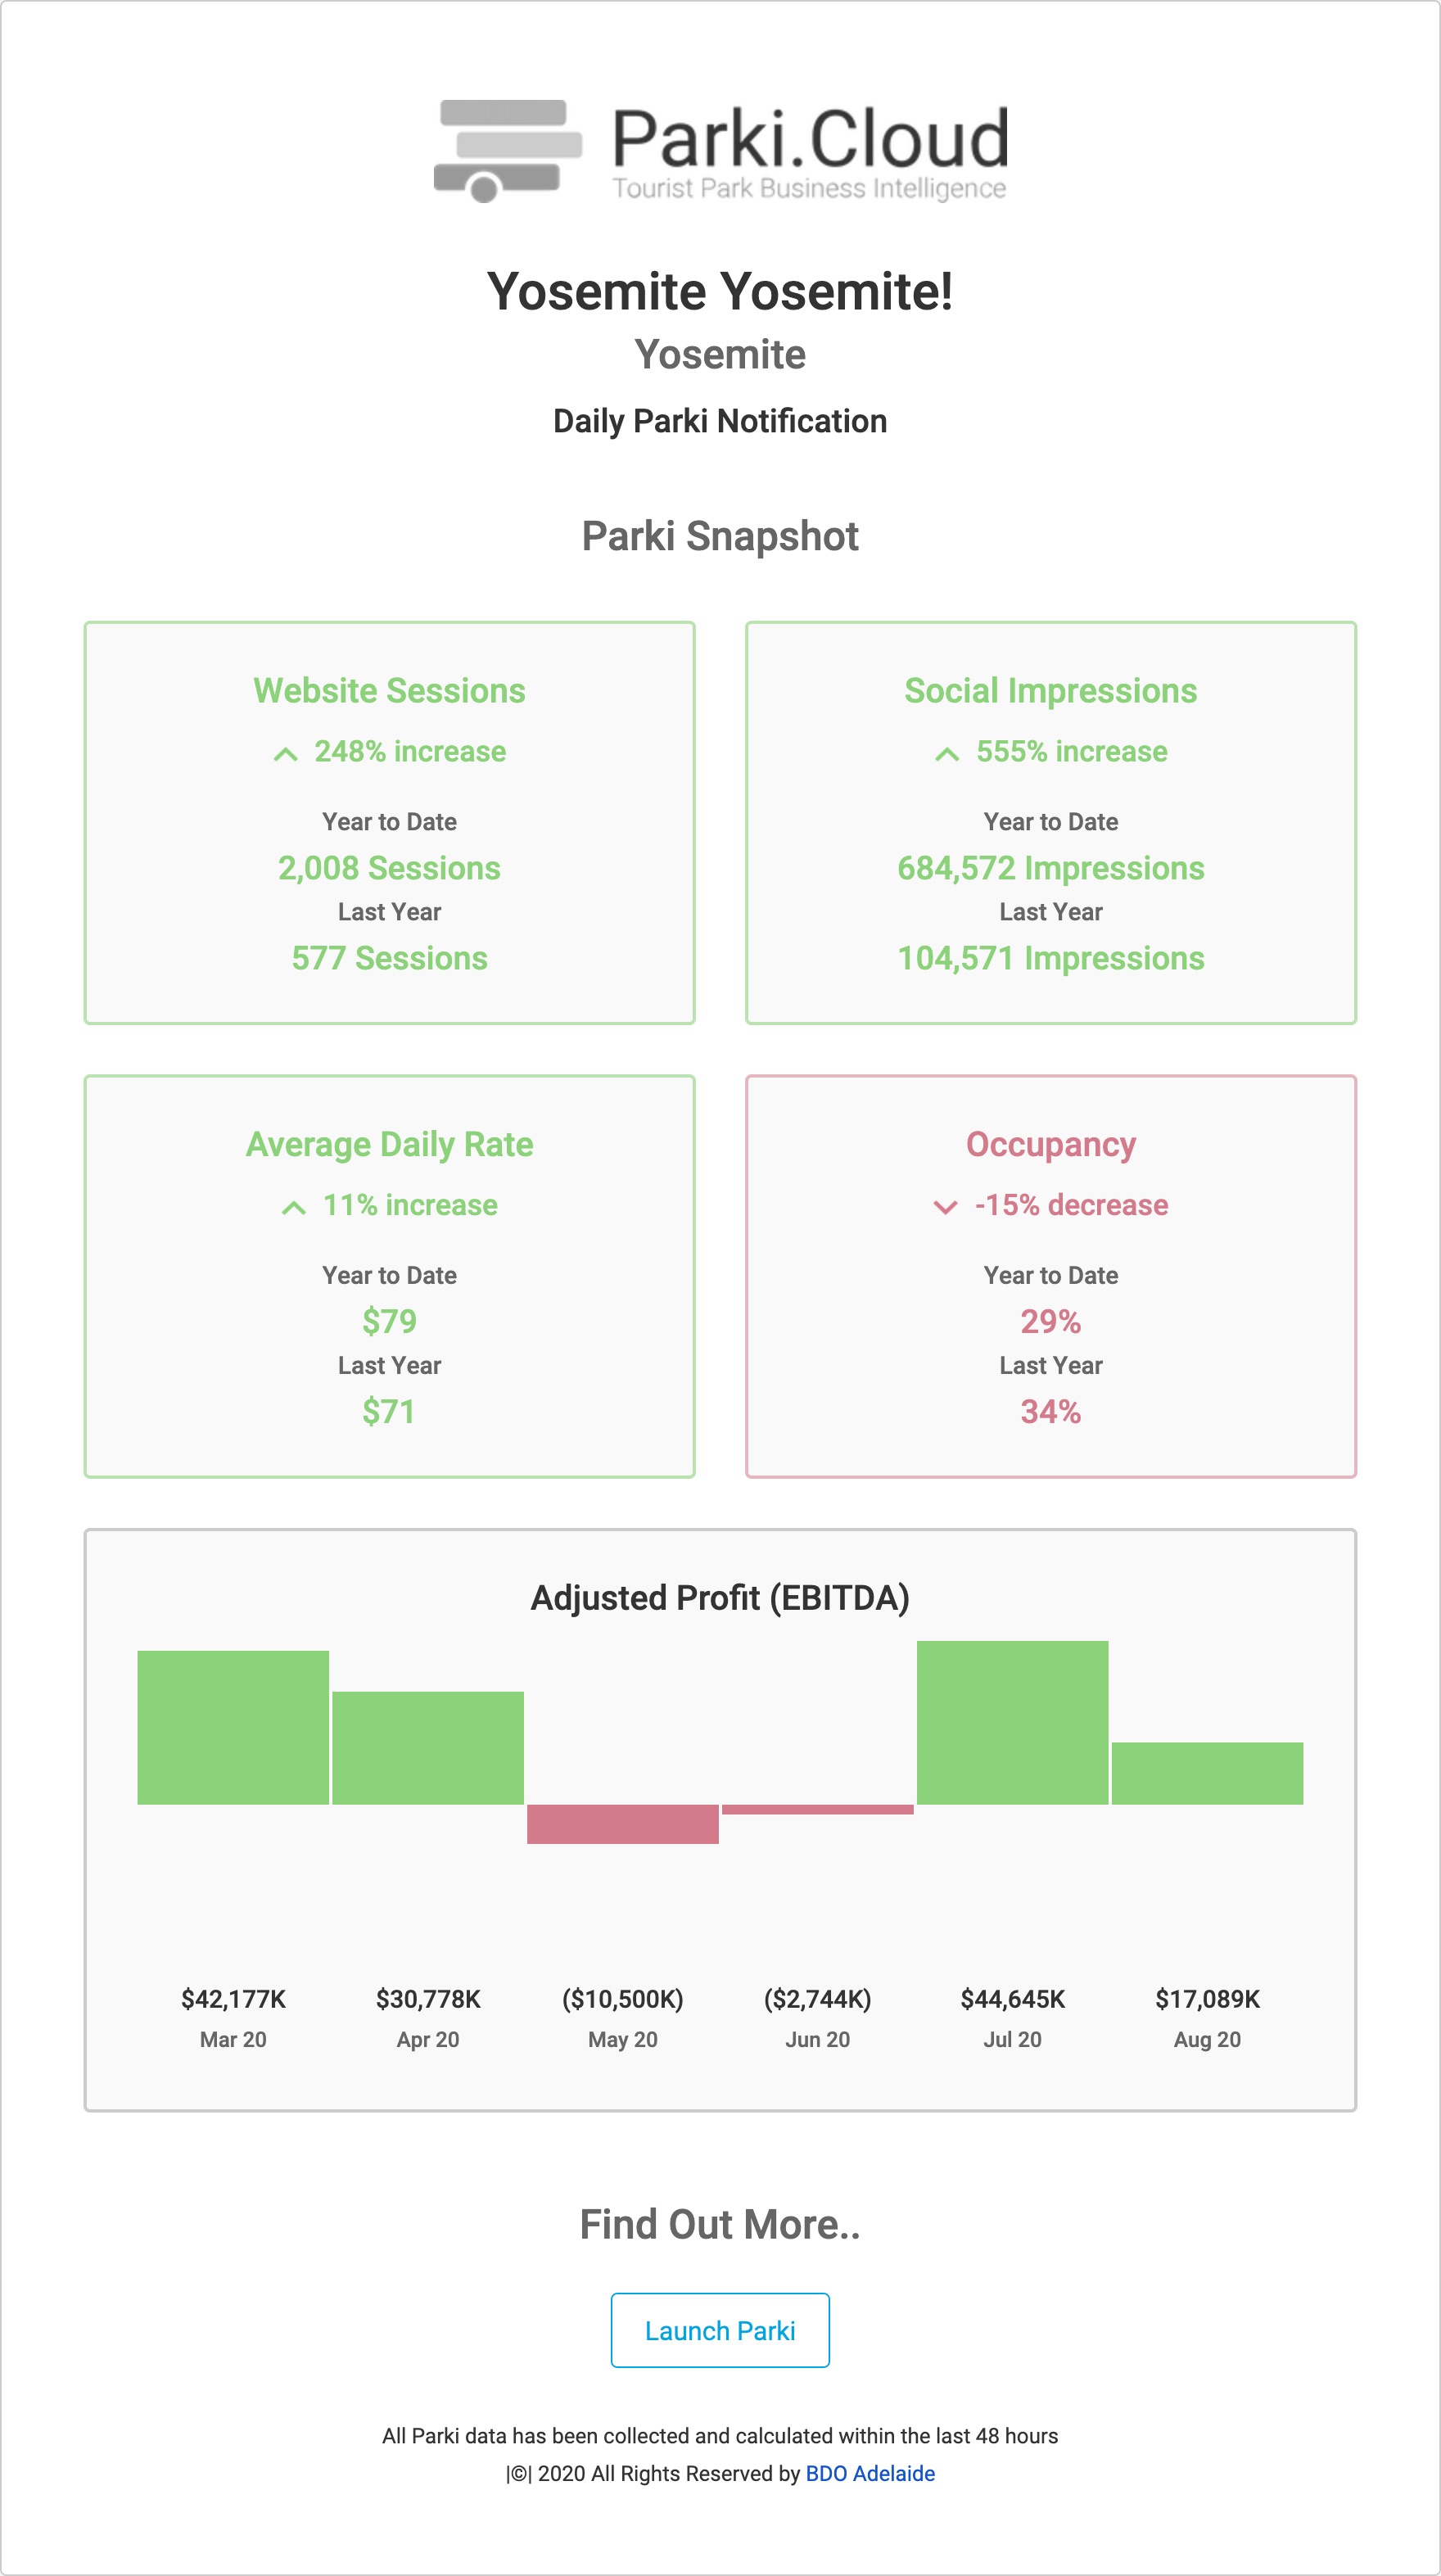
Automated Notifications
A summary of key business statistics and measures are automatically generated and sent to your inbox. These notifcations are sent first thing in the morning.
Notifications can be set to arrive on either a daily or weekly basis.
All The Data You Need
We combine information from popular cloud-based accounting systems Xero, MYOB and Quickbooks Online with property management data from RMS, Newbook and Seekom.
We also gather data from Google's Website Analytics, Facebook and Instagram.


Ready to take the next step?
Get in contact and we'll help you get started.